Unemployment Rate May

An information site for British Migrants to Australia, providing information since October 2005. Post Content follows this advert.

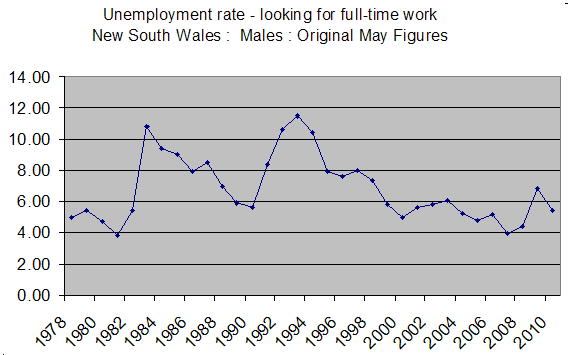
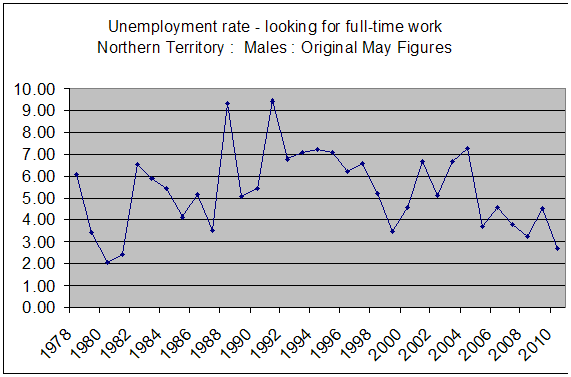
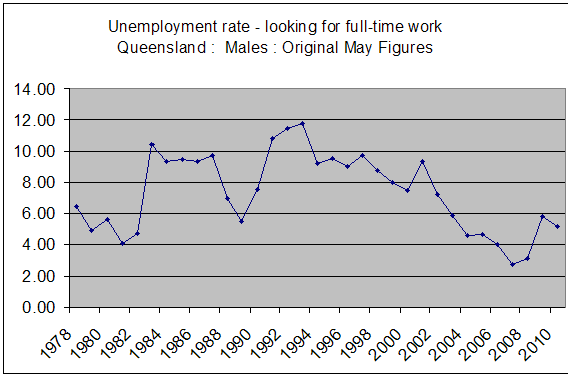
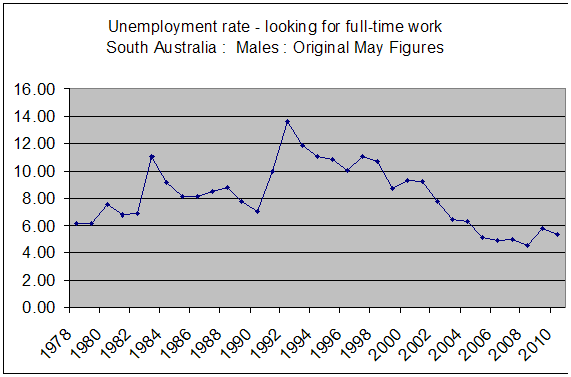
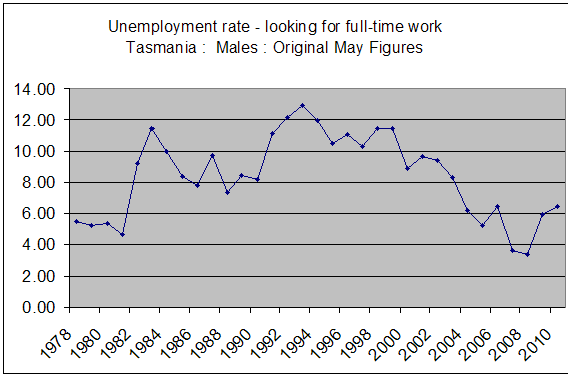
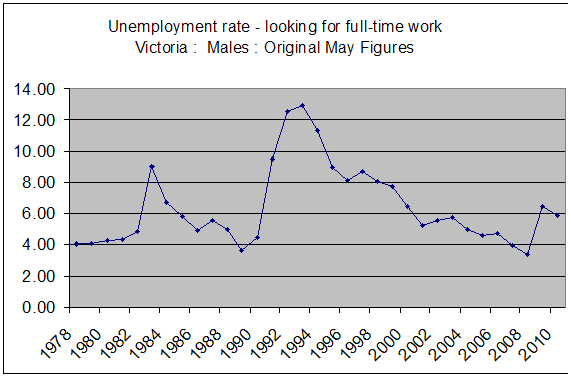
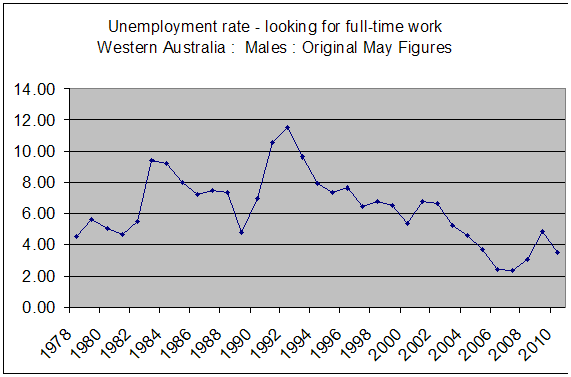
The following charts show the Australian Unemployment Rates for May in each year between 1978 to 2010.

Each chart shows an individual State, and the rate of unemployment for FULL TIME workers.

1994 appears to have been the peak for most States, with 12-14% unemployment rates in most locations.

In 2010 the common rate looks like about 5-6%.

Australian Capital Territory

New South Wales

Northern Territory

Queensland

South Australia

Tasmania

Victoria

Western Australia


0 0 votes
Article Rating
Subscribe
Notify of


This site uses Akismet to reduce spam. Learn how your comment data is processed.

0 Comments
Newest
Oldest Most Voted
Inline Feedbacks
View all comments
0
Would love your thoughts, please comment.x
()
x