The numbers of people from the United Kingdom that are migrating to Australia has recently been reducing, although it may be beginning to pick up again, after a winter (Australian Winter) slump.
This chart shows the 12 months prior to this post, with the comparison of the UK numbers against the total worldwide migrants to Australia.
| Month | From UK | UK % of all | All Settlers |
| Sep-2009 | 1,550 | 12.4% | 12,550 |
| Oct-2009 | 1,550 | 13.4% | 11,600 |
| Nov-2009 | 1,480 | 12.7% | 11,610 |
| Dec-2009 | 1,190 | 10.0% | 11,940 |
| Jan-2010 | 1,410 | 12.3% | 11,470 |
| Feb-2010 | 1,190 | 9.7% | 12,320 |
| Mar-2010 | 1,290 | 10.0% | 12,890 |
| Apr-2010 | 1,200 | 11.1% | 10,780 |
| May-2010 | 920 | 8.7% | 10,540 |
| Jun-2010 | 1,070 | 10.2% | 10,480 |
| Jul-2010 | 830 | 8.5% | 9,710 |
| Aug-2010 | 1,100 | 9.5% | 11,570 |
The following figures show the Annual figures from 1991.
| Year | From UK | UK % of all | All Settlers |
| 1991 | 18,080 | 15.5% | 116,640 |
| 1992 | 11,630 | 12.3% | 94,240 |
| 1993 | 8,680 | 13.2% | 65,670 |
| 1994 | 9,590 | 12.3% | 77,920 |
| 1995 | 11,480 | 11.8% | 96,970 |
| 1996 | 10,810 | 11.7% | 92,490 |
| 1997 | 9,020 | 11.5% | 78,260 |
| 1998 | 8,830 | 10.9% | 81,090 |
| 1999 | 9,600 | 10.9% | 88,020 |
| 2000 | 8,710 | 9.0% | 97,170 |
| 2001 | 8,510 | 8.4% | 100,890 |
| 2002 | 10,180 | 11.4% | 89,360 |
| 2003 | 16,940 | 16.3% | 103,900 |
| 2004 | 16,820 | 14.3% | 117,470 |
| 2005 | 21,780 | 16.9% | 128,760 |
| 2006 | 23,330 | 17.4% | 133,880 |
| 2007 | 23,650 | 16.7% | 141,650 |
| 2008 | 22,680 | 14.0% | 161,520 |
| 2009 | 17,950 | 12.1% | 148,410 |
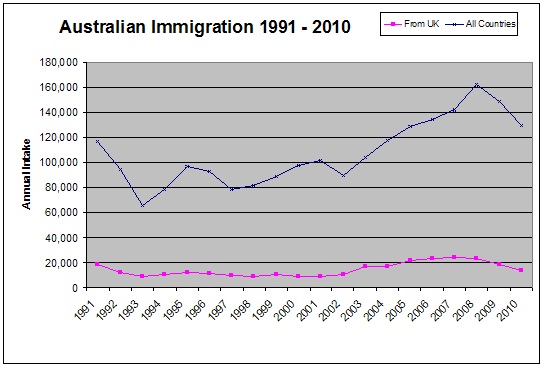
This does show that the recent prime period of the British migration to Australia really got going in 2003, peaking in 2006-07, but dropping down a bit in 2009.
The first 8 months of 2010 totalled 9,010, which would be 13,515 if annualised. This would be a drop back down to normal for the last 20 years.
Edit: 2010 figures now added:
| Year | From UK | UK % of all | All Settlers |
| 2009 | 17,950 | 12.09% | 148,410 |
| 2010 | 12,860 | 9.94% | 129,410 |
From 1991 to 2009, the average annual intake of Migrants from the UK has been 14,120, according to the above figures.
Source: Australian Bureau of Statistics: 3401.12 Overseas Arrivals and Departures
This chart compares ALL migration numbers with just those from the UK between 1991 and 2010.

Another chart of immigration figures, but this one looks at each years 10 month period ending in October each year, and shows the UK, China and India as percentages of the total numbers.