The value of the British Pound at the moment is appearing to be very good in the eyes of many, especially those that are new to watching this particular currency comparison.
The next two graphs though show two very different movements, based on two different time spans.
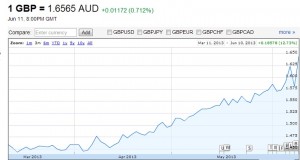
With the value of todays British Pound (GBP) equalling 1.6565 Australian Dollars (AUD) and looking back just a few months, we can see a remarkable improvement in the GBP, or a big decline in the AUD, depending on how we wish to term the movement. (Positive to Britain, or Negative to Australia)
Although saying negative to Australia is incorrect, as the Australian Exporters are rubbing their hands with glee at this big drop in the Australian Dollar Exchange Rate.
Why ? I have been asked this before, so the answer is:
With an AUD/GBP rate of 1.5 :
To sell $1,000,000 of Australian product, the British Importer would have had to pay £666,000 GBP
With an AUD/GBP rate of 1.65 :
To sell $1,000,000 of Australian product, the British Importer would have had to pay £600,000 GBP
Clearly this means more sales by the Australian Exporter, and the cost of imported goods in the UK will begin to rise again.
This graph shows a solid rise in the value of the GBP, over the last few months: March 2013 to June 2013.

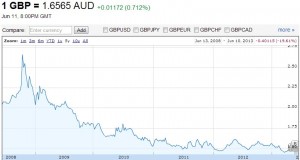
This next graph however, shows a very different movement, when looked at over a longer period of time, June 2008 to June 2013.

One thing is clear, we have different perceptions depending on how long we have been watching the currency pair.
