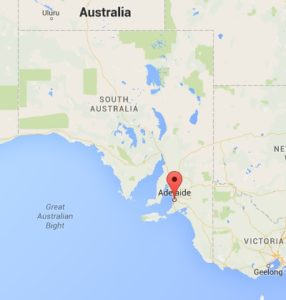
Changes in Australian Median House Prices 2003 to 2015 for Adelaide and South Australiad
Median Price of Established House Transfers in South Australia
| Median Price of Established House Transfers | ||
| Adelaide | Rest of SA | |
| Dec-2003 | $ 247,500 | $ 162,000 |
| Dec-2004 | $ 270,000 | $ 182,000 |
| Dec-2005 | $ 280,000 | $ 199,000 |
| Dec-2006 | $ 300,000 | $ 215,000 |
| Dec-2007 | $ 358,000 | $ 245,000 |
| Dec-2008 | $ 355,000 | $ 245,000 |
| Dec-2009 | $ 398,800 | $ 267,000 |
| Dec-2010 | $ 410,000 | $ 277,300 |
| Dec-2011 | $ 385,000 | $ 270,000 |
| Dec-2012 | $ 395,000 | $ 250,000 |
| Dec-2013 | $ 412,000 | $ 268,300 |
| Dec-2014 | $ 427,000 | $ 275,000 |
| Dec-2015 | $ 442,800 | $ 275,500 |
Median Price of Attached Dwelling Transfers in South Australia
| Median Price of Attached Dwelling Transfers | ||
| Adelaide | Rest of SA | |
| Dec-2003 | $ 191,000 | $ 85,000 |
| Dec-2004 | $ 220,000 | $ 112,000 |
| Dec-2005 | $ 228,800 | $ 145,000 |
| Dec-2006 | $ 246,000 | $ 150,000 |
| Dec-2007 | $ 290,000 | $ 169,500 |
| Dec-2008 | $ 300,800 | $ 202,000 |
| Dec-2009 | $ 326,800 | $ 196,000 |
| Dec-2010 | $ 335,000 | $ 185,000 |
| Dec-2011 | $ 327,300 | $ 176,000 |
| Dec-2012 | $ 325,000 | $ 170,000 |
| Dec-2013 | $ 330,000 | $ 196,000 |
| Dec-2014 | $ 345,000 | $ 180,500 |
| Dec-2015 | $ 350,000 | $ 206,000 |
Source:
ABS 6416.0 – Residential Property Price Indexes: Eight Capital Cities, Dec 2015
Adelaide property prices are based on the Greater Adelaide area with a population of about 1,304,631 and covering an area of 3,257.7 km2 ( 1,257.8 sq miles).
Population Density of Adelaide is about 1,037 people per sq mile.
South Australia has a population of about 1,698,600 and a land area of 983,482 km² (379,725 sq miles).
Population Density of South Australia is about 4.5 people per sq mile.
About 77% of the South Australian population live in its Capital City, Adelaide.

