1984 to 2012 Changes in House Prices:
Perth has been the fastest growing City for median house prices during the 28 years from 1984, with an average increase of 8.36% per year, while Adelaide in South Australia has been the slowest with an average annual rise of just 6.32%.
Median House Prices have risen over these 28 years by the following average annualised growth rates:
| Annual Property Growth By Capital City over 28 years | |
| 8.36% | Perth |
| 7.27% | Brisbane |
| 7.14% | Melbourne |
| 6.99% | Hobart |
| 6.50% | Sydney |
| 6.50% | Canberra |
| 6.32% | Adelaide |
How do prices really affect house buyers?
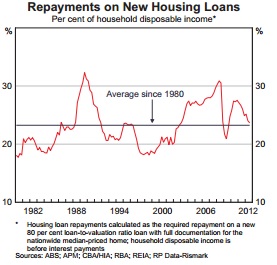
Mortgage Payments as % of Income:
In 2011 90.1% of mortgage payments were UNDER 30% of household income.
In 2006 91.6% of mortgage payments were UNDER 30% of household income.
In 1984 The average New mortgage payment was about 20% of household Income.
In 2012 The average New mortgage payment was about 24% of household Income.
These rates have fluctuated between 18% (1980 and 1998) and 32% (1989 and 2008) over these years. The 21% in 2009 seems a bit out of place, but maybe because only well off people took out new mortgages during that time.

Source: http://www.rba.gov.au/publications/bulletin/2012/dec/pdf/bu-1212-2.pdf
